Confirm Your Instincts About User Behavior and Identify the Keywords and Topics to Drive Your Content to the Top of Search Results.
DemandJump’s Topic Summary Dashboard is an easy-to-understand and actionable representation of your Insight Reports combined with your current state in the market. The Topic Summary Dashboard compares your organic search share against your competitors, while also showing the top keywords, phrases, and questions your customers search. The Topic Content Summary details how you are currently performing and gives you content ideas that will help you improve your search rankings.
How To Find the Topic Content Summary Dashboard
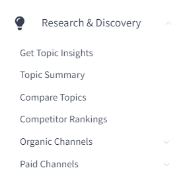
Once you’ve run an Insight Report on your desired topic, go to the Research and Discovery section in the left navigation bar. Topic Summary is the second option in this menu.
Once you’ve entered the topic summary, look to the blue box in the upper right corner which says “Topic.” This is where you can select which Insight Report you want to see a Topic Summary for. In the example below, the selected topic is content marketing.
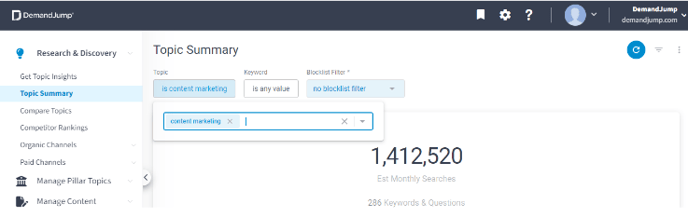
If you type in the topic you want to summarize and don’t see it reflected in the menu, you might need to add it to your list of potential pillar topics. Even when you are working on a shorter piece of content than a pillar, the Topic Summary can still be very useful, so don’t hesitate to use this tool to gain insights about all your types of content.
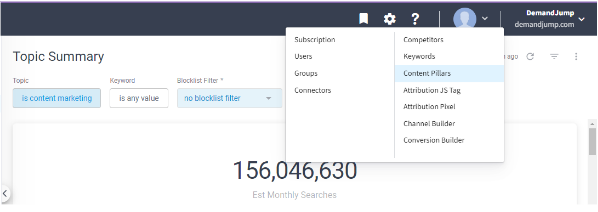
To link an Insight Report to the Topic Summary Dashboard, go to the Settings Icon in the top right. Content Pillars is the third option in this menu.
Once you click Content Pillars, you will be directed to a list of fields where you can input your Insight Report topic which is missing from your Topic Summary list.
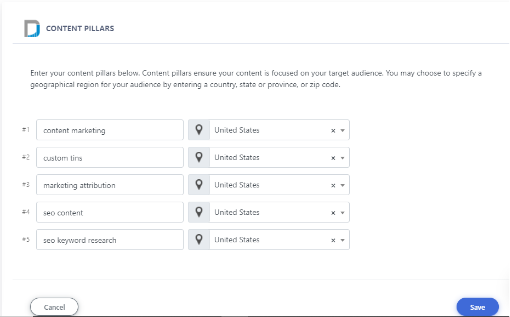
Changing these topics won’t delete any Insight Reports or anything like that. All this does is help you unlock more insights!
Features of the Topic Content Summary Dashboard
Now that you have navigated to the Topic Summary Dashboard, how do you understand it? Here are the sections which contain the insights and what you can learn from each.
Estimated Monthly Searches
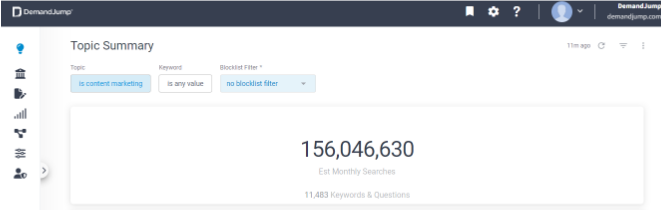
The first section in the Topic Content Summary is the estimated monthly searches for your topic. This also states how many keywords and questions are being searched around your topic. We start with this so you understand exactly the market potential of the content you have in mind.
Organic Market Share Chart
Next is the most striking section of the Topic Content Summary, a colorful chart showing who in your market is winning the ranks.
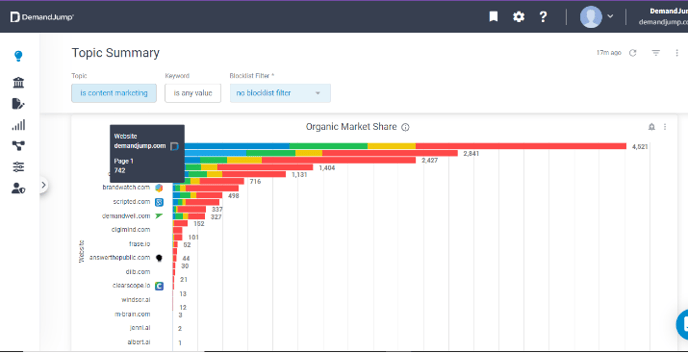
When you hover over any of the bars in the chart, DemandJump tells you exactly how many keywords related to the topic each company is ranking for. We also show if they are ranking on page one, two, three, or four+. In the example above, our own website is the second bar in the chart for content marketing, and we have 742 “content marketing” related keywords which we are ranking on page one for.
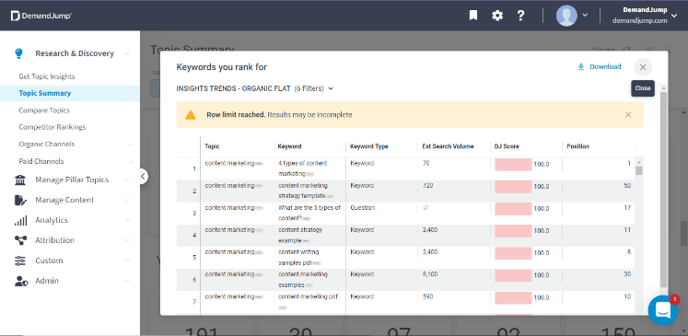
Want to know more? Click the section of the bar you are hovering over, and a popup will open.
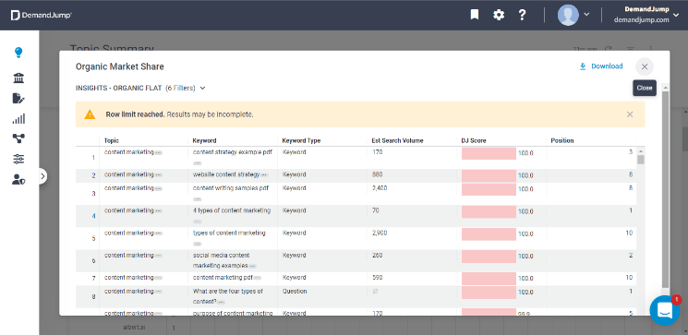
In this menu, you see the topic being summarized, as well as the keyword which is included in the content. The estimated monthly search volume for each keyword, as well as the website’s ranking for that phrase or question, is also here in some of the rightmost columns.
Yes, you can see this for your competitors represented in the Organic Market Share Chart, too! It’s not just colorful, it’s incredibly useful.
Top Keywords, Phrases, and Questions
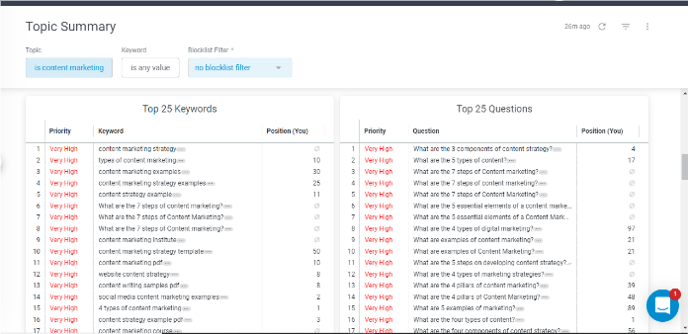
Scrolling down the Topic Content Summary Dashboard, you will next encounter the Top 25 Keywords and Top 25 Questions which are relevant to your topic. Your current ranking for each of these keywords is also included, so you can prioritize in accordance with your strategy.
If you already see a topic you want to write about, click the ellipsis to its right and choose “Write About This” to generate a Content Brief which will give even more granular insight into how to win ranks for that exact keyword or question.
Current Performance Insights
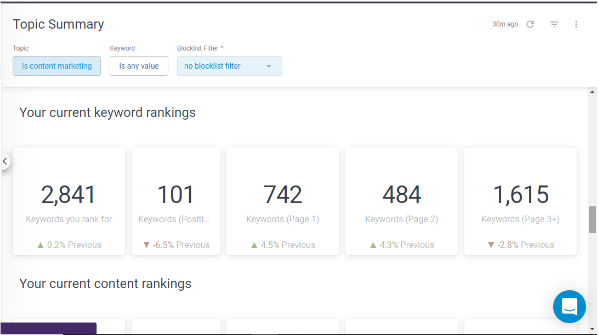
Next in the Topic Content Summary is a breakdown of your current keyword rankings and current content rankings. If you’ve been using DemandJump for a while this will also show you how these metrics have changed since your last Topic Summary on this subject.
If you would like more insights about any of these metrics, simply click it and see a menu with more detail. This is such an easy way to prove ROI to stakeholders!
Next Steps Recommendations
Last in the Topic Content Summary are some next steps recommendations for how to act on the insights. These include both new topics you should write about and advice about how to upgrade existing content to give it more juice.
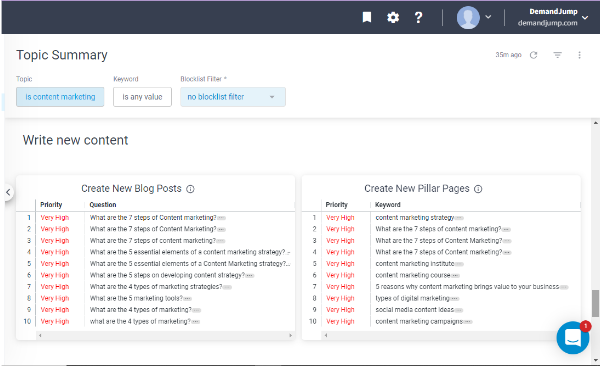
In the example above you may notice “what are the 7 steps of content marketing” appears multiple times with small variations in capitalization. That simply underscores the different ways some users are asking their questions or making searches. Regardless of the capitalization, that is obviously a very high value topic to write about!
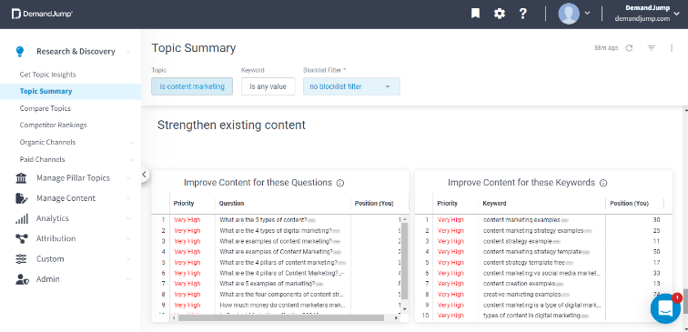
The Strengthen Existing Content section recommends keywords to work into your content which is ranking on pages 2-4 to supercharge them and get them on page one. If you’ve already created a lot of content which isn’t performing how you want, this might be a better approach than just continuing to do new pieces.
Now you know what each section of the Topic Content Summary Dashboard can do for you–-and that’s a lot! We hope you have fun seeing and playing with all this data. If you’re still not sure what to do or how to do it, remember you can always reach your Customer Success Manager through the chat box in the lower right corner. Happy exploring!